数据表格展示
扩展组件 » 数据表格展示
数据表格展示

步骤 1: 创建HTML页面
步骤 2: 创建数据表格
属性
| 名称 | 类型 | 描述 | 默认 |
|---|---|---|---|
| autoUpdateDetail | boolean | 定义更新行时是否更新行细节内容。 | true |
| detailFormatter | function(index,row) | 格式化程序函数以返回行详细信息内容。 |
事件
| 名称 | 参数 | 描述 |
|---|---|---|
| onExpandRow | index,row | 展开一行时触发。 |
| onCollapseRow | index,row | 当一行折叠时触发。 |
方法
| 名称 | 参数 | 描述 |
|---|---|---|
| fixDetailRowHeight | index | 固定细节行高度。 |
| getExpander | index | 获取行扩展对象。 |
| getRowDetail | index | 获取行细节容器。 |
| expandRow | index | 扩展一行。 |
| collapseRow | index | 折叠一行。 |
| subgrid | conf |
创建一个嵌套的子网格。conf参数具有“options”和“subgrid”属性。
1)选项:定义如何呈现datagrid。子网格的options对象有一个“foreignField”属性。foregin值将被发送到服务器以检索子网格的数据。
2)子网格:定义是否创建子网格。定义后,将创建嵌套的子网格。
用法实例:
var conf = {
	options:{
		//the master grid options
	},
	subgrid:{
		options:{
			foreignField:'orderid',	// the foregin field name
			//foreignField:function(prow){
			//	return {
			//		orderid: prow.id,
			//		ordername: prow.name
			//	}
			//}

			//other grid options
		},
		subgrid:{
			options:{
				foreignField:...,
				//other grid options
			}
		}
	}
};
$('#dg').datagrid().datagrid('subgrid', conf);
|
| getSelfGrid | none | 获取本身 datagrid对象。 |
| getParentGrid | none | 获取父类datagrid对象。 |
| getParentRowIndex | none | 获取父行索引。 |
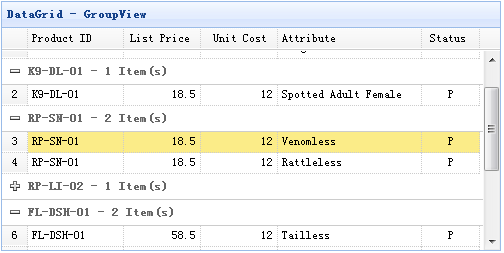
数据表格展示
步骤 1: 创建HTML页面
步骤 2: 创建数据表格
属性
| 名称 | 类型 | 描述 | 默认 |
|---|---|---|---|
| groupField | string | 指示要分组的字段。 | |
| groupFormatter | function(value,rows) | 返回组内容的格式化程序函数。值参数表示由“groupField”属性定义的组值。rows参数根据指定的组值指示数据行。 | |
| groupStyler | function(value,rows) |
返回组的CSS样式的函数。值参数表示由“groupField”属性定义的组值。rows参数根据指定的组值指示数据行。
用法实例:
$('#dg').datagrid({
	groupStyler: function(value,rows){
		if (value == 'RP-LI-02'){
			return 'background-color:#6293BB;color:#fff;'; // return inline style
			// the function can return predefined css class and inline style
			// return {class:'r1', style:{'color:#fff'}};
		}
	}
});
|
事件
| 名称 | 参数 | 描述 |
|---|---|---|
| onExpandGroup | groupIndex | 展开组时触发。 |
| onCollapseGroup | groupIndex | 当一组折叠时触发。 |
方法
| 名称 | 参数 | 描述 |
|---|---|---|
| expandGroup | groupIndex | 扩展一组。 |
| collapseGroup | groupIndex | 折叠一组。 |
| scrollToGroup | groupIndex | 滚动到一个组。 |
| refreshGroupTitle | groupIndex | 刷新组标题。 |
DataGrid BufferView
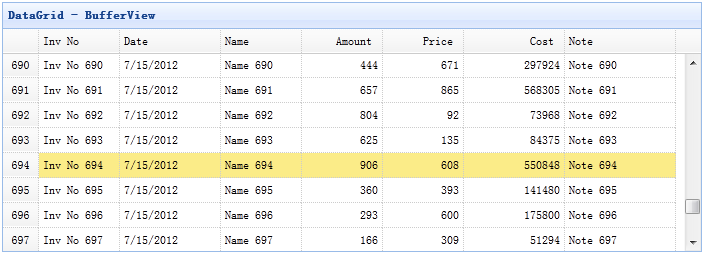
步骤 1: 包括bufferview javascript文件
步骤 2:创建数据表格
数据表格虚拟视图
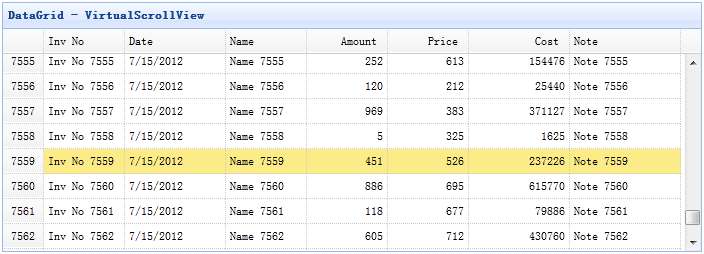
步骤 1: 包括scrollview javascript文件
使用虚拟滚动视图创建DataGrid
方法
| 名称 | 参数 | 描述 |
|---|---|---|
| getRow | index | 获取指定的行数据。 |
| gotoPage | page |
转到指定的页面。
代码实例:
$('#dg').datagrid('gotoPage', 8);  // go to the page 8
$('#dg').datagrid('gotoPage', {
	page: 12,
	callback: function(page){
		console.log('go to page: ' + page);
	}
});
|
| scrollTo | index |
将视图滚动到指定行.
代码实例:
$('#dg').datagrid('scrollTo', 200);  // scroll to the row 200
$('#dg').datagrid('scrollTo', {
	index: 120,
	callback: function(index){
		console.log('scroll to the row: ' + index);
	}
});
|
| fixDetailRowHeight | index | 固定细节行高度。 |
| getExpander | index | 获取行扩展器对象。 |
| getRowDetail | index | 获取行细节容器。 |
| expandRow | index | 扩展一行。 |
| collapseRow | index | 折叠一行。 |